
Statistics
Number of Students admitted in PG & Ph.D.
| Year >>> | 2018-19 | 2019-20 | 2020-21 | 2021-22 | 2022-23 | 2023-24 | 2024-25 | 2025-26 | ||||||||
| Name of Department | PG | Ph.D. | PG | Ph.D. | PG | Ph.D. | PG | Ph.D. | PG | Ph.D. | PG | Ph.D. | PG | Ph.D. | PG | Ph.D. |
| Department of Agronomy | 12 | 5 | 17 | 9 | 20 | 12 | 17 | 7 | 16 | 1 | 21 | 11 | 19 | 8 | ||
| Department of Soil Science & Agricultural Chemistry | 6 | 3 | 8 | 4 | 12 | 15 | 11 | 1 | 10 | 4 | 2 | 6 | 9 | 3 | ||
| Department of Horticulture & Post-Harvest Technology | 8 | 4 | 10 | 1 | 10 | 1 | 9 | 2 | 7 | – | 11 | 7 | 11 | 3 | 5 | |
| Department of Agricultural Extension | 10 | – | 8 | 4 | 12 | 6 | 11 | 4 | 7 | 6 | 9 | 2 | 11 | 3 | 9 | |
| Department of Plant Pathology | 6 | 4 | 6 | – | 6 | 3 | 5 | 4 | 5 | 1 | 4 | 2 | 3 | 2 | ||
| Department of Agricultural Entomology | 3 | 1 | 6 | 1 | 7 | 1 | 6 | 4 | 5 | 2 | 6 | 2 | 6 | 1 | 5 | |
| Department of Genetics and Plant Breeding | 6 | 3 | 5 | 3 | 4 | 4 | 6 | 2 | 8 | 1 | 5 | 1 | 8 | 2 | 5 | |
| Department of Animal Science | 8 | 4 | 4 | 1 | 5 | – | 10 | 1 | 6 | – | 2 | – | – | – | 3 | |
| Department of Agricultural Statistics | – | 1 | – | 4 | – | 3 | — | 2 | – | 1 | – | 1 | – | 1 | – | |
| Department of Crop Physiology | – | 1 | – | – | – | 1 | – | 2 | – | – | – | 1 | 4 | – | ||
| Department of Agricultural Economics | – | 1 | – | – | – | 2 | 2 | – | 1 | – | 1 | 2 | 1 | |||
| Department of Agricultural Engineering | – | – | – | 1 | – | – | – | 1 | – | 3 | – | 1 | – | – | ||
Number of Students in PSB
| Bachelor’s | Master’s | Ph.D | Total | ||
| 2012-13 | Intake | 55 | 37 | ||
| Enrolled | 49 | 23 | 29 | 101 | |
| Passed Out | 36 | 27 | 8 | 71 | |
| 2013-14 | Intake | 55 | 51 | ||
| Enrolled | 49 | 38 | 25 | 112 | |
| Passed Out | 33 | 33 | 13 | 79 | |
| 2014-15 | Intake | 56+1(Foreign Student) | 51 | ||
| Enrolled | 56+1 | 46 | 61 | 163 | |
| Passed Out | 45 | 24 | 9 | 78 | |
| 2015-16 | Intake | 55+2 (Foreign Student) | 56 | ||
| Enrolled | 55 | 56 | 55 | 166 | |
| Passed Out | 44 | 36 | 18 | 98 | |
| 2016-17 | Intake | 55 | 71 | ||
| Enrolled | 55 | 61 | 26 | 142 | |
| Passed Out | 48 | 35 | 27 | 110 | |
| 2017-18 | Intake | 60+9 (Foreign Student) | 75 | ||
| Enrolled | 60+5=65 | 71 | 31 | 166 | |
| Passed Out | 50 | 52 | 19 | 121 | |
| 2018-19 | Intake | 60+9 (Foreign Student) | 75 | 23 | 158+9 (Foreign Student) |
| Enrolled | 60+5=65 | 62 | 23 | 145+5 | |
| Passed Out | 51 | 54 | 22 | 127 | |
| 2019-20 | Intake | 60+9 (Foreign Student) | 80 | 36 | 176+9 |
| Enrolled | 60+6=66 | 75 | 36 | 171+6 | |
| Passed Out | 46 | 61 | 29 | 136 | |
| 2020-21 | Intake | 71+9 (Foreign Student) | 84+9 (Foreign Student) | 38 | 193+18 (Foreign Student) |
| Enrolled | 68+7=75 | 80+1 (Foreign Student) | 38 | 186+8 (Foreign Student) | |
| Passed Out | 47 | 54 | 23 | 124 | |
| 2021-22 | Intake | 75+9 (Foreign Student) | 84 | 38 | 197+9 (Foreign Student) |
| Enrolled | 75+3=78 | 74+1 (Foreign Student) | 38 | 187+3 (Foreign Student) | |
| Passed Out | 61 | 64 | 18 | 143 | |
| 2022-23 | Intake | 75+9 (Foreign Student) | 84 | 19 | 176+9 (Foreign Student) |
| Enrolled | 71 | 69+2 | 19 | 157+2 (Foreign Student) | |
| Passed Out | 56 | 77 | 29 | 162 | |
| 2022-23 | Intake | 75+9 (Foreign Student) | 84 | 45 | 204+9 (Foreign Student) |
| Enrolled | 65+7=72 | 71 | 45 | 181+7 (Foreign Student) | |
| Passed Out | 64 | 65 | 37 | 166 | |
| 2023-24 | Intake | 75+9 (Foreign Student) | 92 | 45 | 212+9 (Foreign Student) |
| Enrolled | 65+7 (Foreign Student) | 71 | 45 | 181+7 (Foreign Student) | |
| Passed Out | |||||
| 2024-25 | Intake | 79+9 (Foreign Student) | 99 | 27 | 205+9 (Foreign Student) |
| Enrolled | 82+6 (Foreign Student) | 79+2 | 27 | 188+8 (Foreign Student) | |
| Passed Out |
Gender Pattern of Students
| 2012-13 | Male | 34 | 16 | 22 | 72 |
| Female | 15 | 7 | 7 | 29 | |
| 2013-14 | Male | 37 | 33 | 44 | 114 |
| Female | 19 | 13 | 17 | 49 | |
| 2014-15 | Male | 37 | 33 | 44 | 114 |
| Female | 19 | 13 | 17 | 49 | |
| 2015-16 | Male | 36 | 37 | 35 | 108 |
| Female | 19 | 19 | 20 | 58 | |
| 2016-17 | Male | 30 | 41 | 20 | 91 |
| Female | 20 | 20 | 10 | 50 | |
| 2017-18 | Male | 40 | 46 | 21 | 107 |
| Female | 24 | 25 | 10 | 59 | |
| 2018-19 | Male | 38 | 35 | 16 | 89 |
| Female | 27 | 27 | 7 | 61 | |
| 2019-20 | Male | 43 | 46 | 25 | 114 |
| Female | 23 | 29 | 11 | 63 | |
| 2020-21 | Male | 46 | 59 | 18 | 123 |
| Female | 29 | 22 | 20 | 71 | |
| 2021-22 | Male | 47+1(Foreign) | 51 | 25 | 123+1(Foreign) |
| Female | 28+2(Foreign) | 23+1(Foreign) | 13 | 64+3(Foreign) | |
| 2022-23 | Male | 46 | 40 | 12 | 98 |
| Female | 25 | 29+2(Foreign) | 7 | 61+2(Foreign) | |
| 2023-24 | Male | 42+3(Foreign) | 40 | 31 | 113+3(Foreign) |
| Female | 23+4(Foreign) | 31 | 14 | 68+4(Foreign) | |
| 2024-25 | Male | 42+4 | 52 | 18 | 112+4(Foreign) |
| Female | 40+2 | 27+2 | 9 | 76+4(Foreign) |
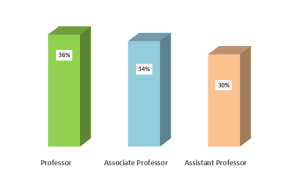
Distribution of Professor, Associate Professor & Assistant professor
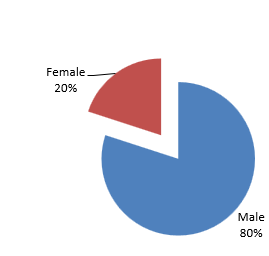
Gender Ratio of Faculty
© Copyrights 2025 VISVA-BHARATI All Rights Reserved.